
- Homepage >
- Instrumentation >
- Phoenix Overview
Phoenix Overview
Overview
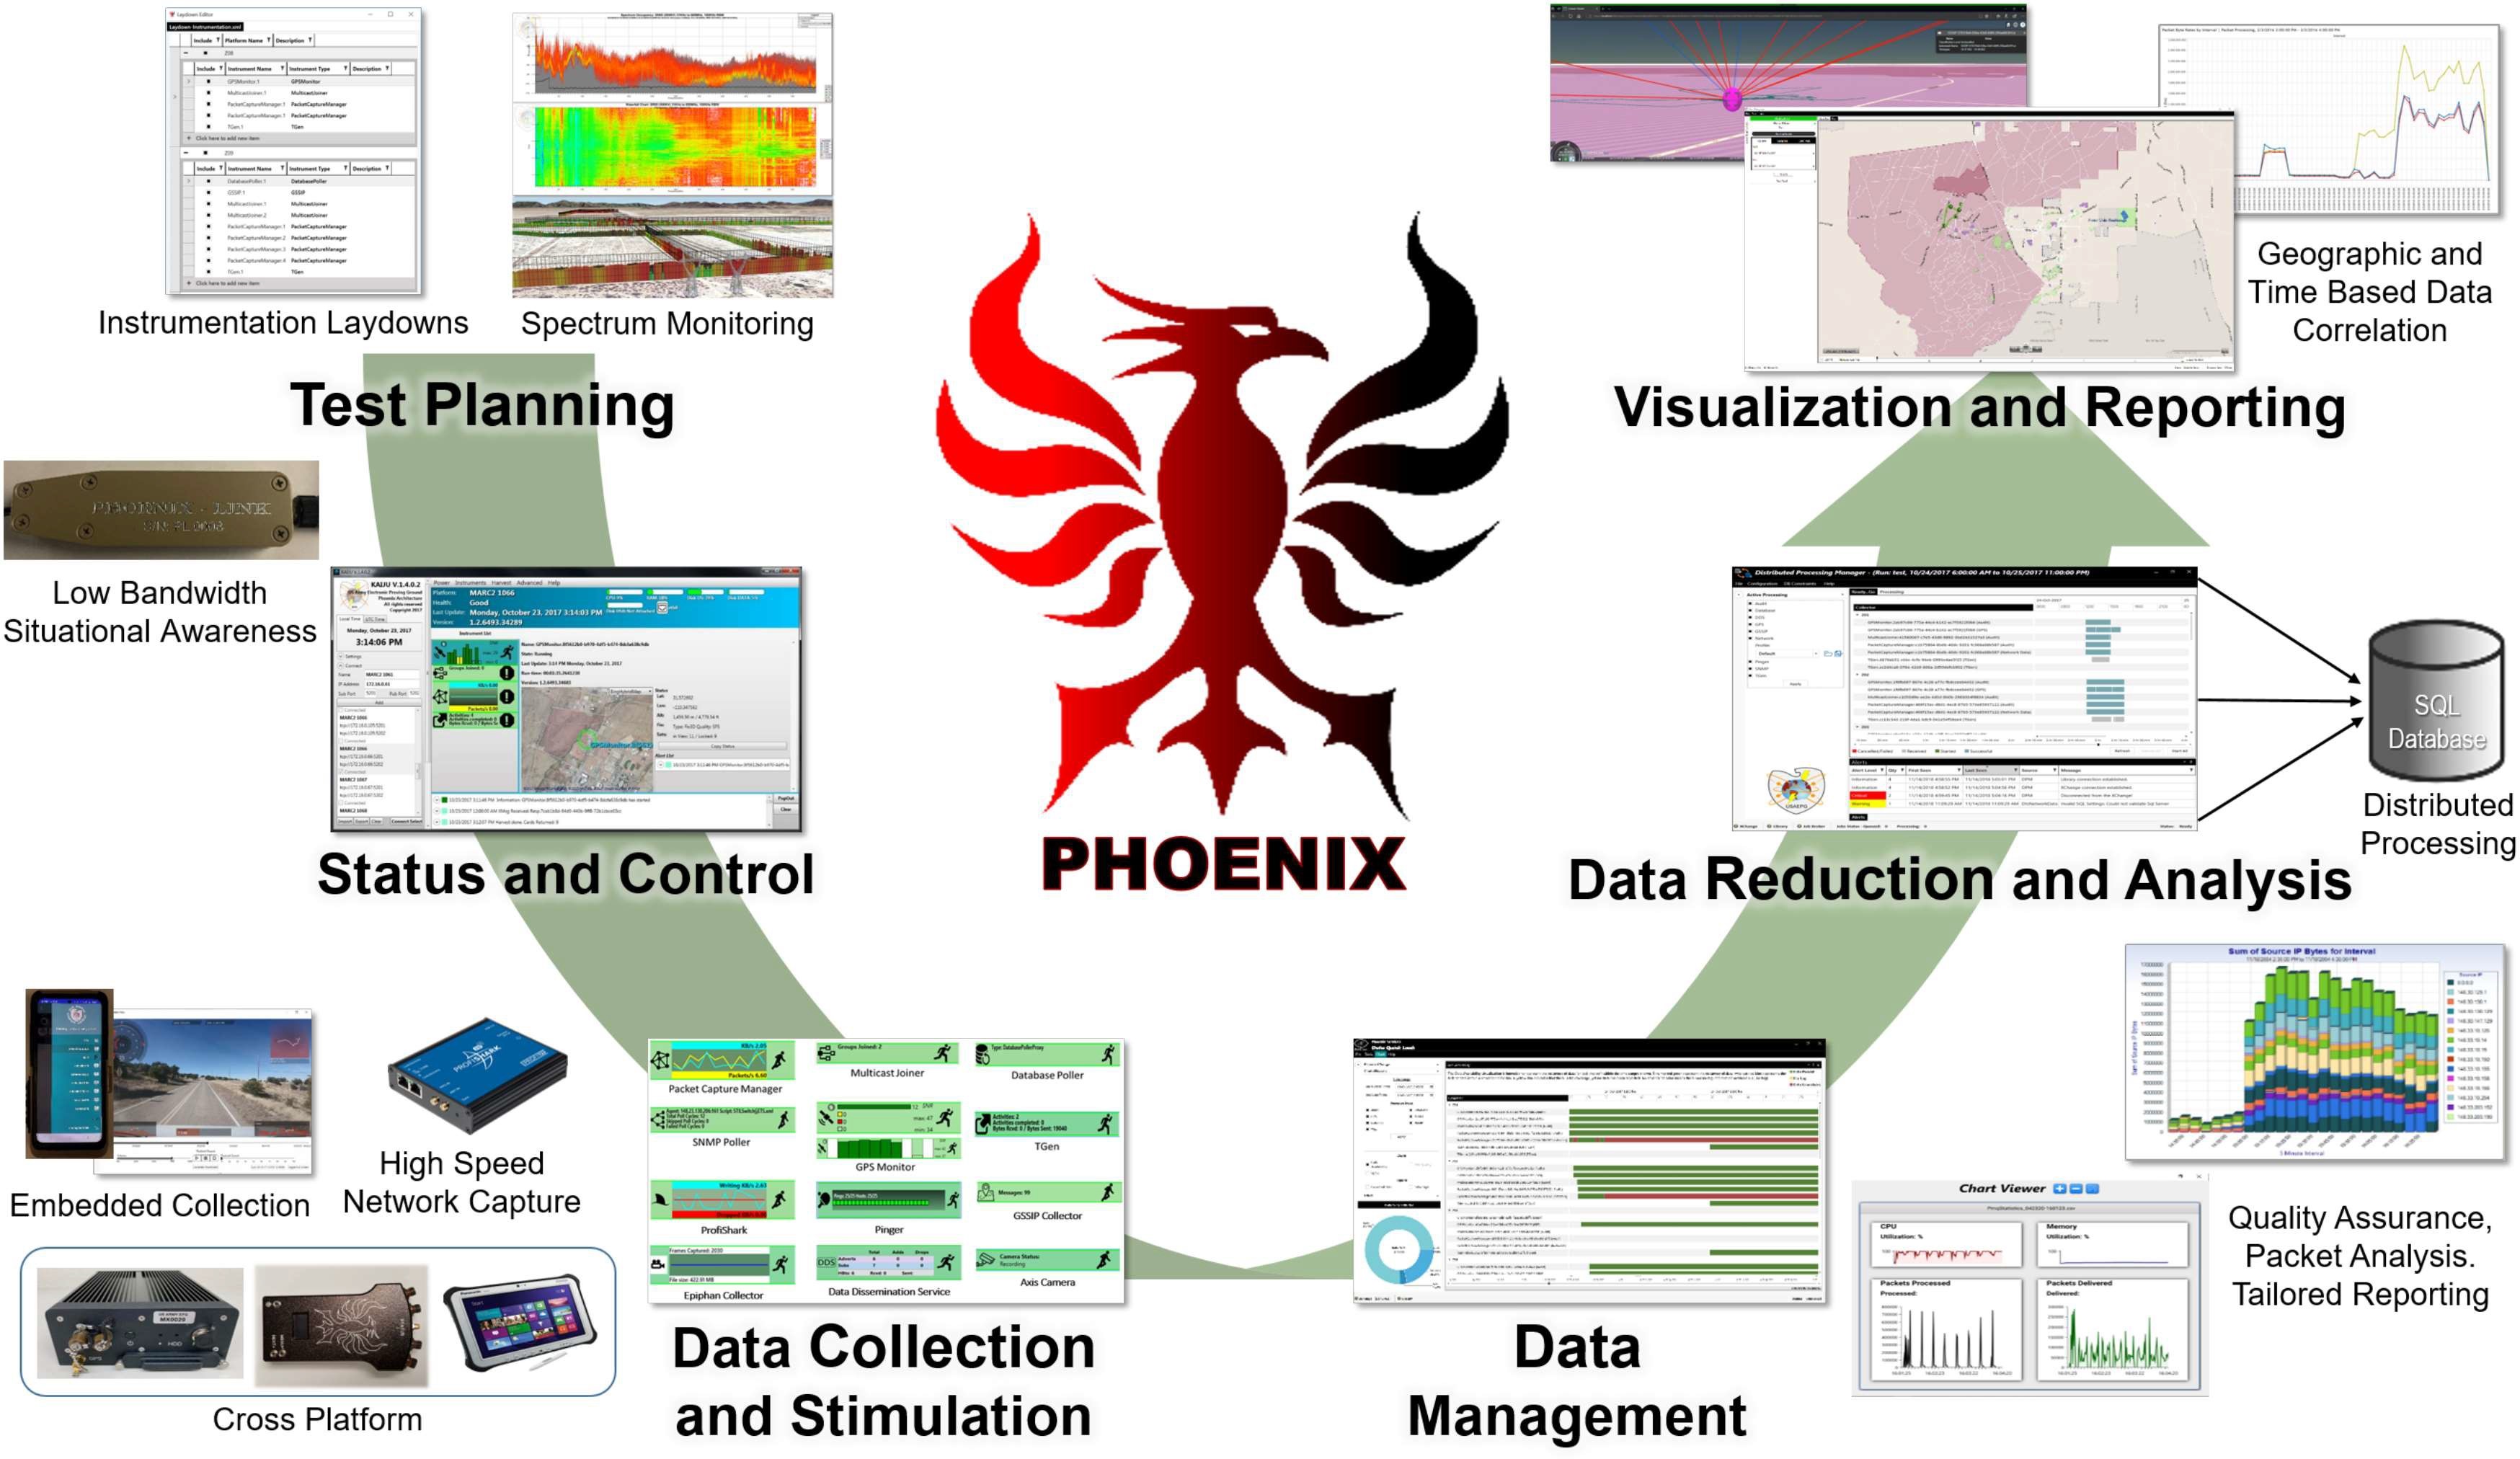
The U.S. Army Electronic Proving Grounds (EPG's) Phoenix Architecture is the overarching structure that integrates all of EPG's test capabilities across six functional areas providing seamless communication and efficient data exchange. These six functional areas include:
- Test Planning
- Status and Control
- Data Collection and Stimulation
- Data Management
- Data Reduction and Analysis
- Visualization and Reporting
Phoenix is composed of both hardware and software components capable of providing test support for testers and developers of new Command, Control, Communication, Computers, and Intelligence (C4I) systems. Phoenix is especially useful for testing distributed system of systems and can be tailored to meet unique requirements of the testing community. The software suite provides stimulation, simulation, collection, reduction, visualization, and analysis of test data. The hardware suite is composed of both COTS and uniquely developed components to handle C4I testing requirements.
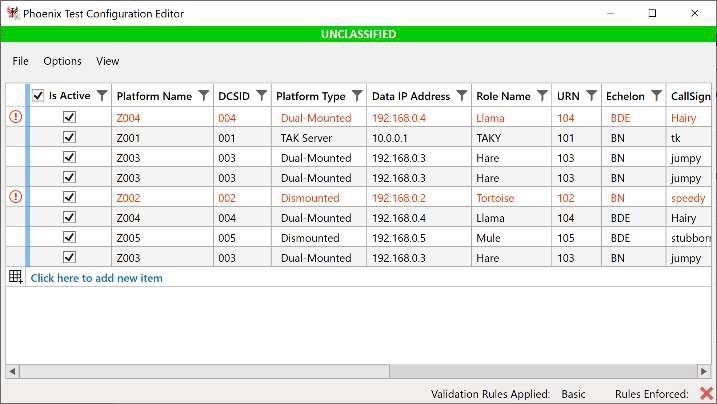
Test Planning
Phoenix provides tools to assist with arduous test planning activities such as the creation and editing of instrumentation laydowns, cutsheets, and network stimulation scripts. The Phoenix Test Configuration Editor (PTCE) application was developed by EPG to provide a singular point to record System-Under-Test (SUT) and instrumented platform configuration information and its correlating instrumentation information. The PTCE application is intended to provide instrumentation and data processing personnel a means to record configuration information into a common "master" format. In turn this information will then be used in the data reduction and analysis of collected test data.
Data Collection and Stimulation
The Phoenix Instrumentation Suite includes a variety of software instruments that interface with the SUT to collect a specific type of data or provide specific stimulation/simulation input. When applicable, Phoenix instruments are designed to be platform and Operating System agnostic. The loosely coupled design principles employed in the Phoenix architecture allow for EPG to easily add new instruments to adapt to continuously changing test needs. Some of the current Phoenix Instrumentation data collection and stimulation capabilities include:
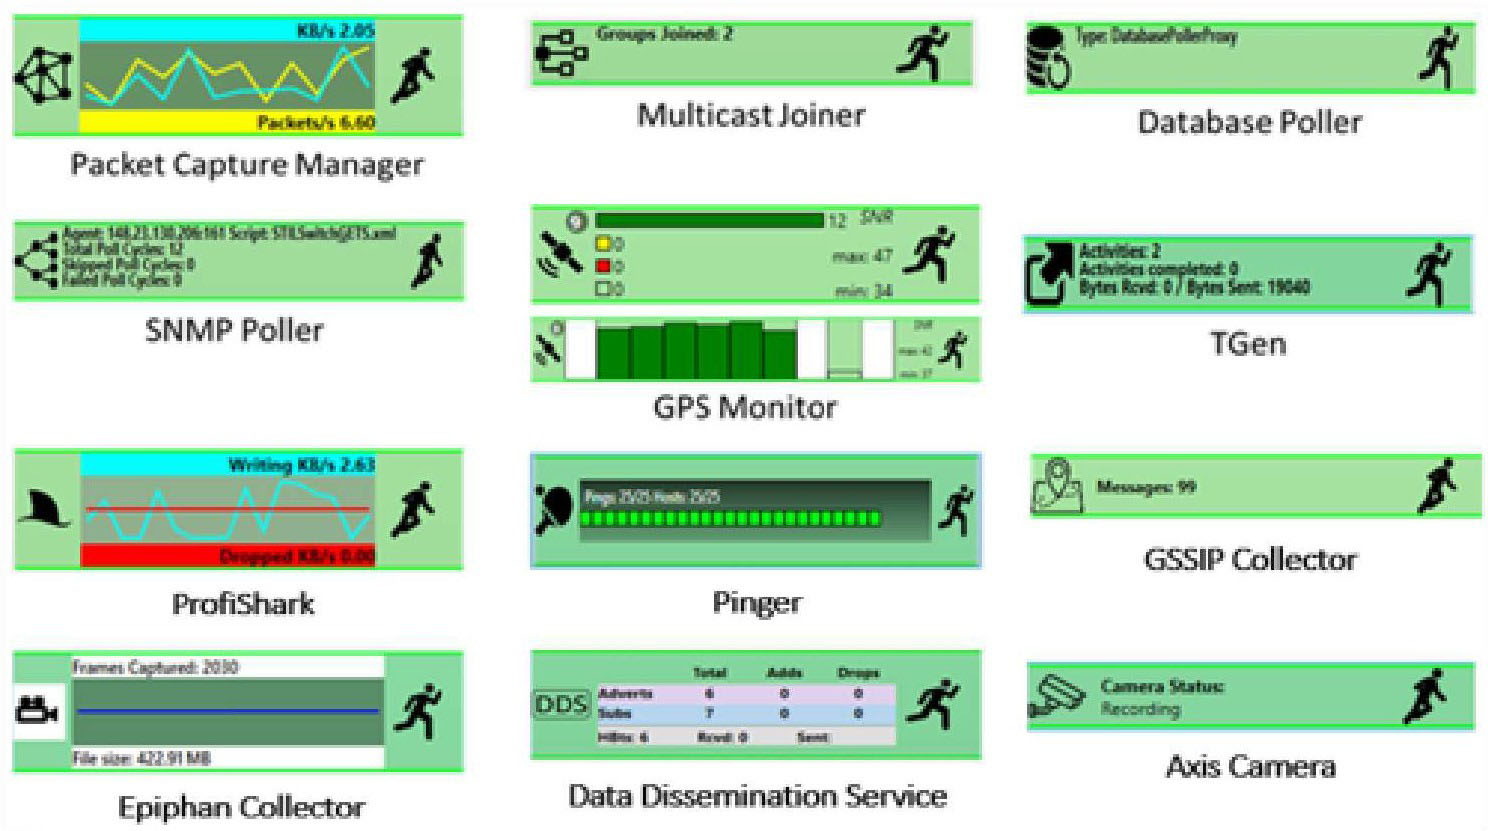
- Network traffic (PCAP) capture
- Traffic loading stimulation
- GPS monitoring
- SNMP polling
- Database querying
- DDS monitoring
- Video capture
- Voice collection
- Manual Data Collection (Survey/Form Completion)
- Radio Frequency (RF) monitoring and analysis
- Environmental data collection (barometric pressure, temperature, humidity)
- Network diagnostic collection and analysis (pinger, reverse proxy, sniffer)
EPG provides various types of data collection solutions to allow testers to use the best approach for each SUT. For appended instrumentation requirements EPG has developed external devices, such as the Mobile Autonomous Remote Collector, Version 2 (MARC2), that can tap into the SUT and run Phoenix instruments to stimulate and collect data. Additionally, EPG utilizes available Commercial off-the-shelf (COTS)/Government off-the-shelf (GOTS) products whenever possible. This allows for the integration of existing industry standard products into Phoenix, such as the ProfiShark Gigabit Network Tap Capture Tool which provides +/-15 nanosecond timing accuracy. For embedded instrumentation requirements, EPG has software that can reside on the SUT to stimulate and collect data, such as the VICTORY Data Logger or Android Data Collector. This wide variety of instrumentation available within the Phoenix architecture provides EPG customers with the best solution to meet all of their unique data collection needs.
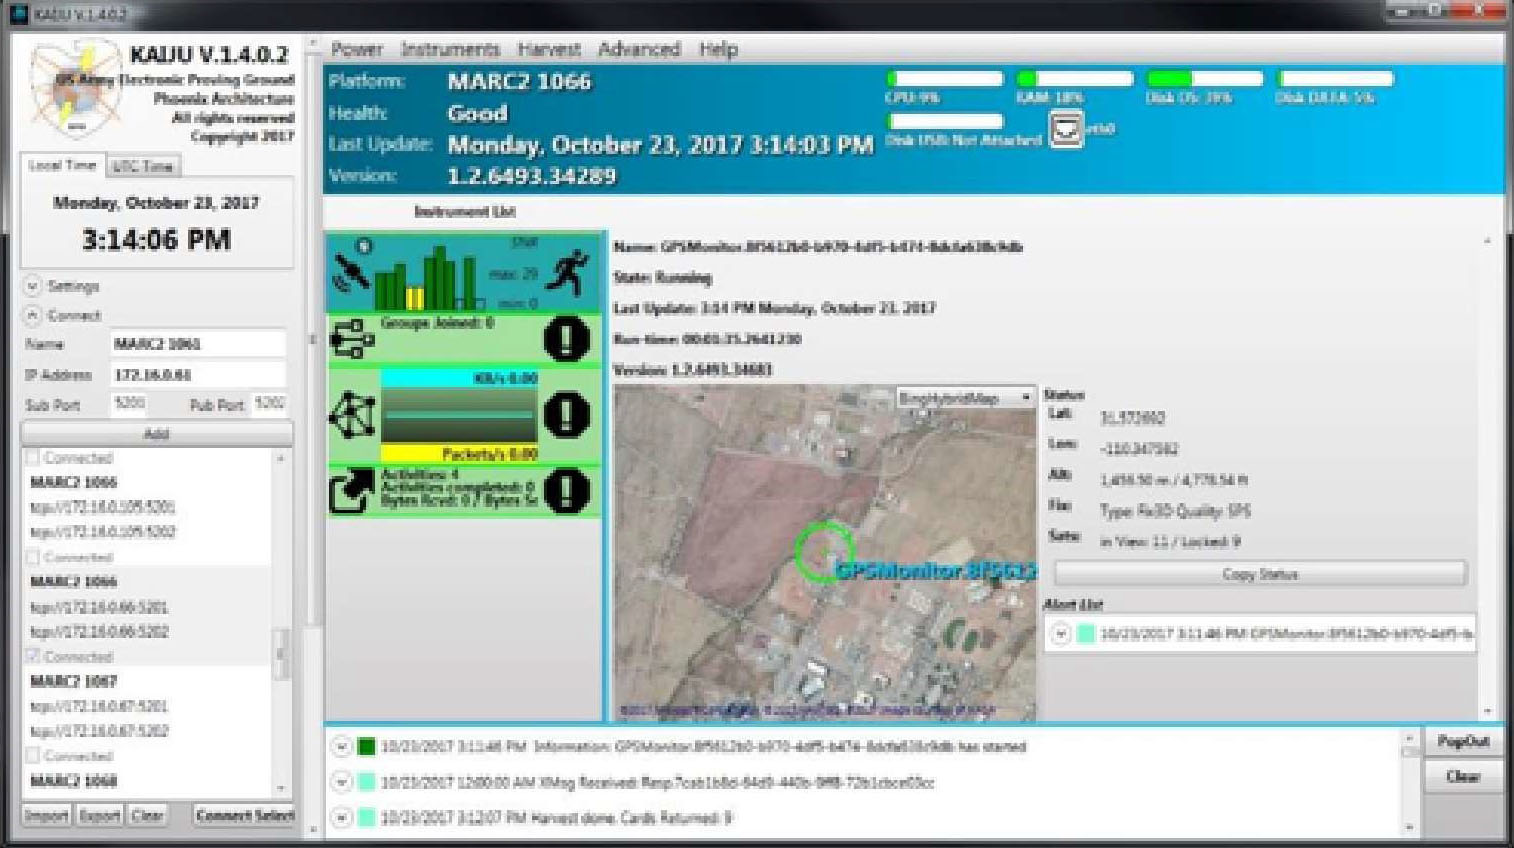
Status and Control
Phoenix provides local and centralized command and control over remote instruments and sensors. The Kaiju application lets users configure and command instruments, view status information, and harvest collected data. The flexibility of Phoenix instrumentation allows it to be run in both connected and disconnected configurations. When a test instrumentation network is available, instruments can provide scalable status information dependent on bandwidth availability. EPG also provides devices such as the Phoenix-Link (P-Link), which is a low-throughput long-range radio that can be used to support near real-time situational awareness and command and control of test instrumentation assets.
Data Management
Phoenix was designed to efficiently organize and distribute large data sets. Phoenix collected data has an immutable identity from cradle to grave through the use of globally unique identifiers (GUID). Additionally, all files created by Phoenix have an accompanying MetaCard with metadata containing basic information about how, where, and when the data was collected. This MetaCard data is stored in the Data Catalog. The data is then stored in a Data Repository and referenced by the Data Catalog.
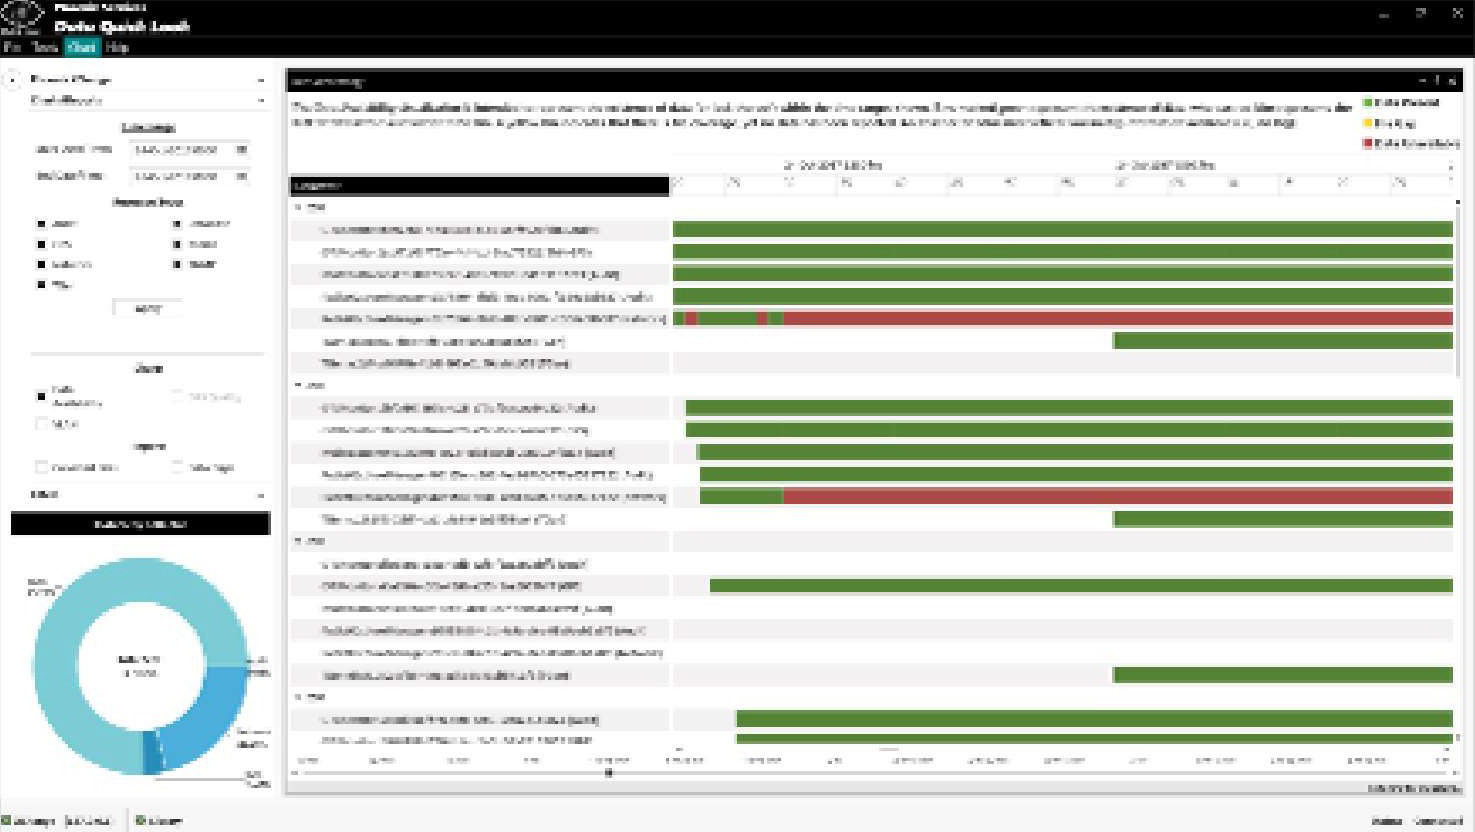
These Data Management practices allow applications such as Data Quick Look to provide an efficient overview on the state of the collected data by accessing the metadata available in the Data Catalog. This reduces turnaround time for Quality Assurance and accountability of collected data before the data reduction and analysis process starts.
Data Reduction and Analysis
Phoenix data reduction and analysis software allows for data to be rapidly processed by dividing work into jobs and maximizing concurrency using a loosely coupled model of grid computing. This provides maximum flexibility and scalability in computing hardware/network topology.
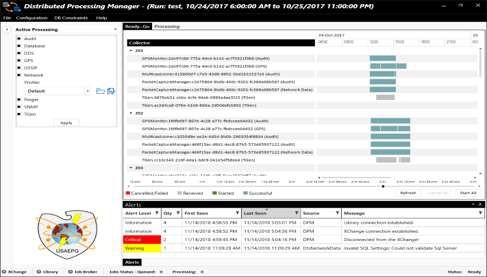
The Phoenix Data Processing (PDP) Suite takes all of the data collected by Phoenix Instrumentation and processes it into formats more suitable for reporting and analysis. It primarily consists of Data Transformation Services (DTS) plugins that do the actual data reduction work and the Distributed Processing Manager (DPM) for command, control, and monitoring. The Phoenix database (a SQL Server database) serves as the primary storage medium during data reduction and analysis.
SQL Findings is a set of Microsoft SQL stored procedures that can be used to perform packet matching, CoT message matching, JVMF message matching, and SA Visibility reporting. SQL Findings installs on top of the Phoenix database produced by PDP. Reports and charts can then be generated from SQL Findings output tables using Excel or Tableau.
Packets Matched Quickly (PMQ) is EPG's next generation of data processing. While there may always be a need to fully process every packet into a database, PMQ provides a way to produce a quick approximate measurement of packet completion rate and speed of service (SoS) from the PCAP Indexes. This optimized data processing solution produces network performance output significantly faster than legacy processes, which considerably aids in product development and early detection of network issues.
Visualization and Reporting
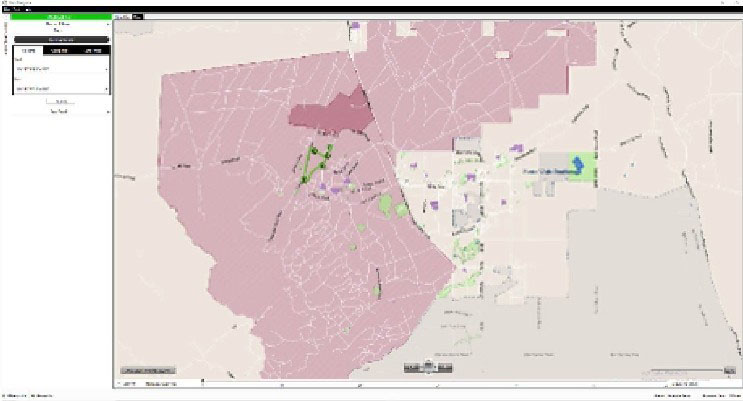
Data Navigator is Phoenix's primary data visualization tool. It provides a visual representation of the current data in a data repository including counts, data types represented, and advanced views for discovering correlations in the data. It allows for an analyst to quickly identify and narrow down only the data vital to analysis.
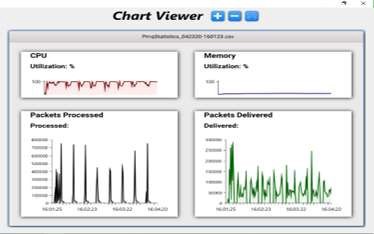
The Quick Results application quickly provides charts and diagrams from network packet capture index files generated by Phoenix packet capture instruments. This allows visualization of various network related products, such as bandwidth usage charts and internet protocol (IP) communications diagrams, without having to process millions of packets into a database first.
For any custom visualization and reporting needs, the dynamic capabilities of the Phoenix architecture easily allows for the creation of tailored data visualization dashboards and displays.